- Sports 150
- Posts
- Sporting Goods 2025: The New Performance Economy
Sporting Goods 2025: The New Performance Economy
How shifting consumer behavior, competitive dynamics, and structural industry forces are redefining growth in sport and active living.

I. Introduction
The sporting goods industry enters 2025 at a moment of unprecedented cultural and economic relevance. Participation in sports and fitness has accelerated globally: over 40% of consumers now identify as “active lifestyle” shoppers, and more than 70% of Gen Z considers wellness and physical performance core to their identity. Equipment demand is being reshaped by powerful forces, from the rise of hybrid training routines (home + club), to the explosive adoption of connected gear, with smart sensors embedded in everything from running shoes to rackets. The rebound of group sports is also fueling new demand patterns, with team registrations across football, basketball, and racket sports growing 10–15% year-over-year.
Sustainability is no longer a branding exercise but an operational mandate. In 2024, one in three sporting goods purchases was influenced by circular-economy offerings like refurbished gear, trade-in programs, or recycled materials, pushing brands toward more traceable and transparent supply chains. Meanwhile, geopolitical and logistics volatility have forced companies to rethink manufacturing footprints, accelerating nearshoring, automation, and inventory discipline.
Digital behavior is equally transformative. More than 55% of shoppers now begin their sporting goods search on social platforms, where micro-communities in running, padel, golf, and pickleball shape trends faster than traditional retail cycles can adapt. The surge in women’s sports, with global viewership up over 25% year-over-year, continues to generate unmatched momentum in female-focused performance apparel and equipment. Together, these dynamics position sporting goods as one of the most innovation-driven consumer categories in 2025, shaped by technology, culture, sustainability pressures, and a more performance-oriented global consumer.
II. Market Size Evolution and Growth Dynamics
The global sportswear market has experienced steady expansion since 2017, with retail sales values rising from $272 billion in 2017 to a projected $433 billion in 2025, reaching an estimated $548 billion by 2029. Over the period shown, the market achieved a Compound Annual Growth Rate (CAGR) of 8% from 2017 to 2019, followed by slower growth of 7% from 2021 to 2024, and is forecasted to soften further to approximately 6% annually between 2024 and 2029.
The year 2025 sits at the midpoint of this trajectory, representing a continuation of solid post-pandemic recovery, although growth has normalized from the unusually high rebound rate seen around 2021.

Regional Breakdown of the Market in 2025
In 2025, the distribution of the global sportswear market remains regionally diverse, with notable differences in growth momentum:
North America continues to be one of the largest contributors, reaching $173 billion in 2025. While the region’s projected CAGR stabilizes at 5% for 2024–2029, it remains a core driver of global demand.
Asia–Pacific plays a critical role in global expansion. It reaches $119 billion in 2025 and, despite slowing compared to its earlier double-digit CAGR (14% from 2017–19), it is expected to maintain healthy growth at 6% between 2024–29.
Western Europe grows to $78 billion in 2025, with an anticipated CAGR of 5% in the following years. The region shows stable but moderate expansion compared with Asia–Pacific and Latin America.
Latin America reaches $32 billion in 2025 and is projected to accelerate to a notable 12% growth rate from 2024 to 2029, the fastest among all regions, indicating rising consumer purchasing power and increased sports participation.
Eastern Europe totals $17 billion in 2025 and is expected to grow at 6% from 2024–29, rebounding from earlier disruptions.
Rest of World (Africa, Australia, the Middle East, and New Zealand combined) amounts to $26 billion in 2025. With a projected 10% CAGR going forward, this region signals emerging opportunities driven by demographic expansion and rising lifestyle-driven consumption.
2025 as a Transition Year
Market conditions in 2025 reflect a transition from the volatile recovery period of the early 2020s into a phase of normalized growth. Several factors characterize this shift:
Demand stabilization after strong pandemic-related rebounds.
More predictable consumer spending patterns, especially in mature markets such as North America and Western Europe.
Accelerating growth in developing markets, particularly Latin America and parts of the Rest of World category.
Intensifying competition, with brands expanding digital channels, sustainability programs, and product innovation pipelines to maintain share in a moderating growth environment.
Implications for the Sporting Goods Sector in 2025
The 2025 landscape presents both opportunities and challenges for companies operating in the sporting goods industry:
Rising consumer expectations around sustainability and performance technology are reshaping product strategies.
The continued rise of direct-to-consumer channels demands greater investment in digital infrastructure and data analytics.
Regional nuances, such as high growth potential in Latin America versus slower expansion in Western markets, require localized strategies for pricing, distribution, and branding.
Supply chain resilience remains essential due to ongoing global uncertainties, although pressure has eased compared to the early 2020s.
The sporting goods market in 2024 continues to be shaped by a clear structural divide between equipment-driven categories and the broader group of protective gear, sports bags, and accessories. As shown in Exhibit X, equipment accounts for 61.7% of total market share, two-thirds of global spending, while the combined share of the remaining categories represents 38.3%.

This distribution underscores the sector’s reliance on performance-oriented, durability-driven equipment purchases that support both organized sports and the rise of hybrid fitness routines. Equipment maintains a dominant position because it is directly tied to participation: as more consumers adopt structured weekly training habits, invest in new sports, or return to group activities, demand for high-quality gear remains strong.
In contrast, protective gear, bags, and accessories, while essential, tend to operate as complementary categories with slower replacement cycles and more discretionary purchasing patterns. Their 38% share reflects stable but secondary spending behaviors, especially outside high-intensity sports.
Looking ahead to 2025, the equipment segment is expected to retain its leadership due to three reinforcing dynamics:
Growth of racket and emerging sports (padel, pickleball, and badminton), all of which are equipment-intensive.
Higher engagement levels among active consumers, driving more frequent equipment refresh and upgrades.
Innovation cycles, including connected gear and sport-specific engineering, further pulling demand toward equipment-heavy categories.
For brands, the implication is clear: category leadership and revenue resilience continue to concentrate in equipment, making product quality, innovation, and community engagement critical levers for defending or expanding share in 2025.
IV. Profitability and Growth Archetypes
While the global sporting goods market expanded steadily over the past five years, performance across individual companies has diverged sharply. New McKinsey data shows that only three in ten players managed to outperform the market on revenue and expand margins simultaneously since 2018, a clear indication that growth in this category has become harder to achieve and even harder to monetize.
The industry can be segmented into four archetypes based on revenue growth (relative to the market) and profitability trends between 2018 and 2024:

1. Accretive Growers (31% of companies)
These are the industry’s top performers, companies that grew faster than the market while also expanding EBIT margins. On average, they delivered:
+7% real revenue growth
+4 p.p. EBIT margin expansion
Accretive growers typically led in brand relevance, supply chain agility, and innovation cycles. Their ability to scale new categories (e.g., women’s sports, racket sports, connected equipment) positioned them favorably through volatile periods. This group captures the sector’s “efficient growth” benchmark heading into 2025.
2. Accretive Laggards (21% of companies)
These companies improved margins but failed to keep pace with overall market growth. They saw:
+3% real revenue
–7 p.p. margin change
Margin expansion here often came from cost discipline, SKU rationalization, inventory control, and localized production, rather than top-line momentum. Their challenge for 2025 will be reigniting demand without compromising newly regained efficiency.
3. Dilutive Growers (15% of companies)
This segment achieved above-market revenue growth but at the expense of profitability:
–4 p.p. margin decline
+8% revenue growth
For many, growth was driven by aggressive DTC expansion, discount-driven channel strategies, or entry into fast-growing but margin-thin categories. As capital becomes more constrained, these companies face pressure to convert scale into sustainable profit pools.
4. Dilutive Laggards (33% of companies)
The largest group, one-third of the market, lost ground on both revenue and profitability:
–6% real revenue
–15 p.p. margin contraction
These players suffered from demand volatility, high cost bases, and slower reaction times to shifting consumer trends. Many were exposed to excess inventory cycles, wholesale channel pullbacks, or inadequate digital capabilities during the recovery years.
What This Means for 2025
The archetype breakdown highlights a fundamental tension shaping the industry:
Growth no longer guarantees value creation, as seen in the dilutive growers.
Cost control without innovation is insufficient, the accretive laggards risk long-term irrelevance.
Only integrated performance models win, those balancing innovation, supply chain resilience, and disciplined commercial execution.
For companies entering 2025, the data underscores a clear message:
The strategic priority is profitable, not just fast, growth.
Brands that can sustain innovation while tightening margin management will capture outsized gains in a market that is expanding, but becoming more competitive and less forgiving.
V. Physical Inactivity: The Largest Untapped Market Opportunity in Sporting Goods
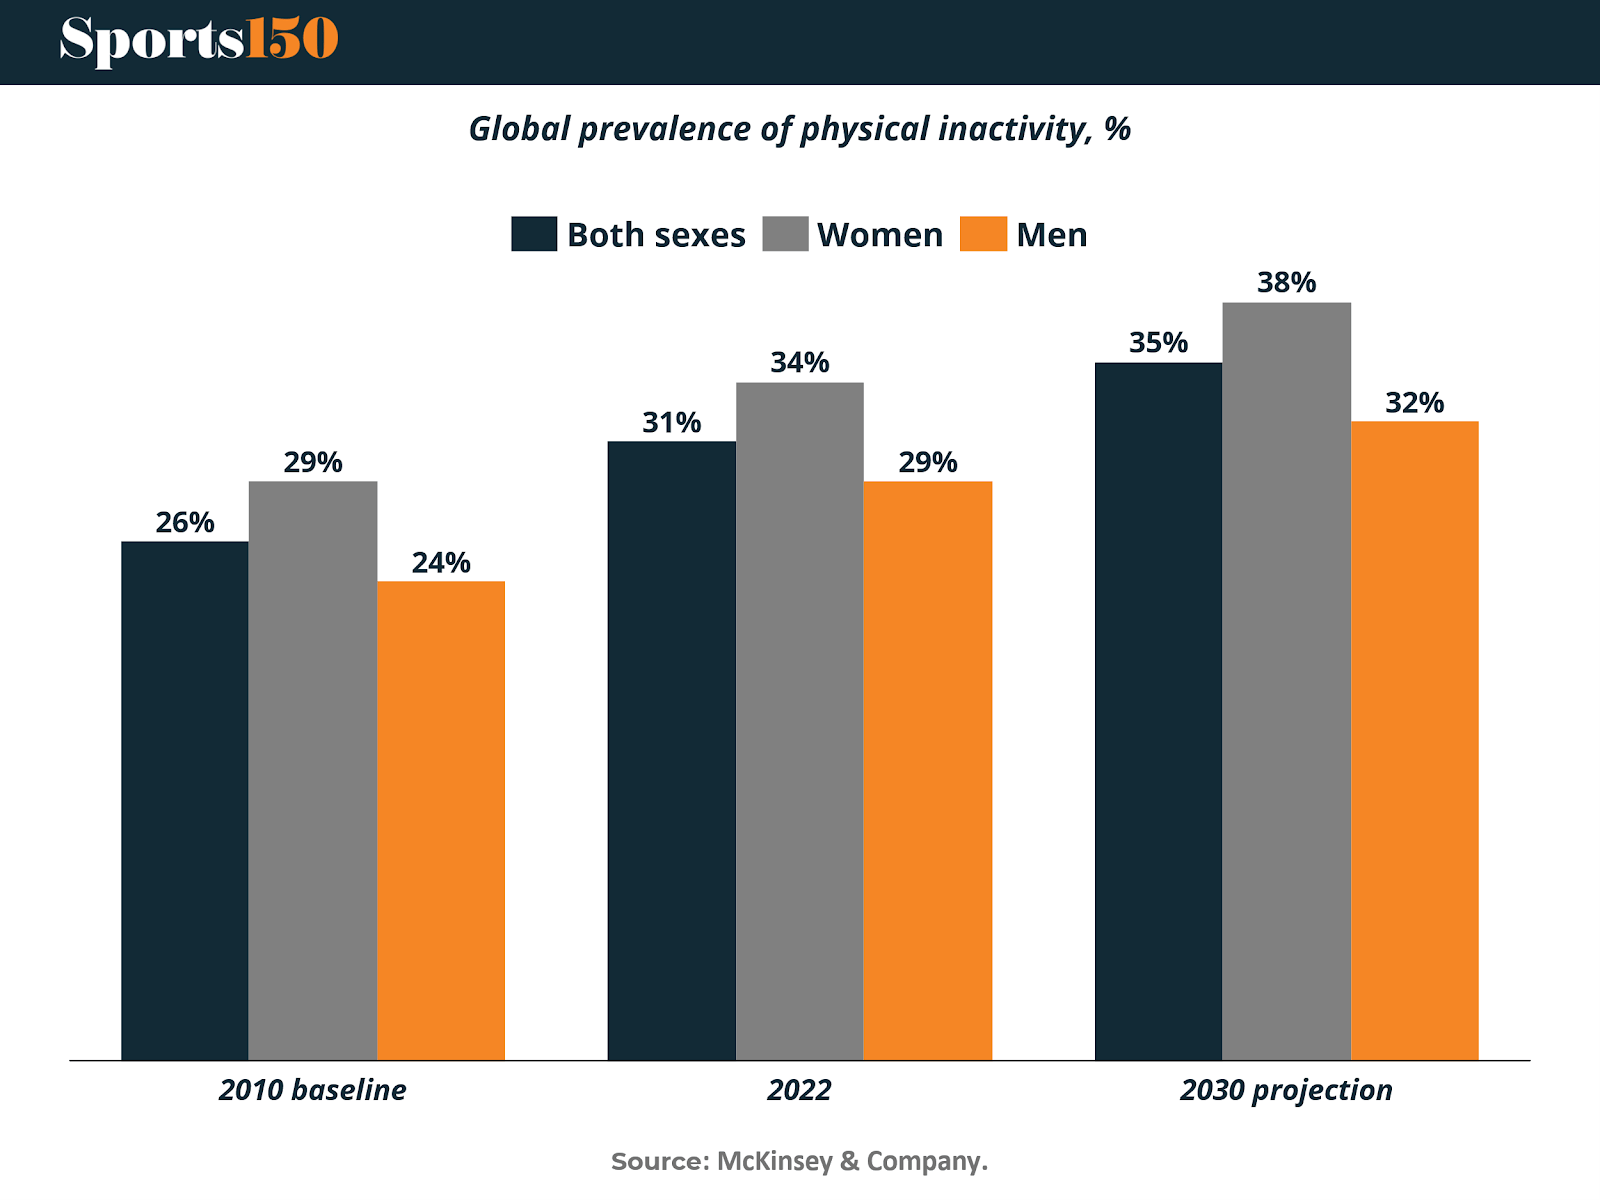
Physical inactivity has quietly become one of the most pressing global health challenges and one of the most overlooked commercial opportunities for the sporting goods industry. Despite decades of clear evidence showing the benefits of exercise, 31% of adults worldwide still fail to meet recommended activity levels. And according to WHO projections, this share is expected to rise to 35% by 2030, marking a sustained, long-term trend rather than a pandemic-related anomaly.
Exhibit 5 illustrates this trajectory clearly: inactivity has risen steadily from 26% in 2010 to 31% in 2022, with increases across both men and women. Globally, women remain five percentage points less active than men, a gap that has not meaningfully narrowed over time and represents a key area of unmet consumer need.
Beyond adults, the data points to an even more concerning generational shift. 81% of adolescents aged 11–17 are not getting sufficient physical activity, signaling a future adult population that may be even more sedentary than today’s.
Yet within this challenge lies significant, underdeveloped market potential.
A 1.8 Billion-Person Opportunity
The global population currently not meeting WHO's recommended physical activity levels totals 1.8 billion adults, twice the size of India’s adult population. For sporting goods companies, this represents the single largest pool of untapped demand in the entire industry.
These consumers are not simply “inactive”, they are underserved. Most current product and marketing strategies remain focused on already-active users. In contrast, unlocking the 1.8 billion-person inactive segment requires innovations that reduce friction, increase accessibility, and reshape cultural perceptions around movement.
Why It Matters: Health, Productivity, and Sustainability
Increasing global activity levels carries wide-ranging benefits across public health, the economy, and environmental sustainability:
Health & Quality of Life
Regular activity reduces the risk of cardiovascular disease, cancer, and type 2 diabetes, while improving weight management and mental health outcomes. It is one of the most effective interventions for anxiety, depression, and stress.
Workforce & Productivity
Healthier employees miss fewer workdays, generate higher output, and reduce long-term healthcare costs. OECD research shows that companies implementing workplace programs to address sedentary behavior can achieve a 4× return on investment.
Sustainability & Urban Mobility
Shifting short-distance mobility to walking, running, or cycling can meaningfully lower emissions while enhancing citywide air quality, making physical activity central to broader ESG agendas.
Key Insights for Sporting Goods Leaders
Rising inactivity levels
Inactivity is climbing from 31% today to 35% by 2030, posing significant health, economic, and environmental risks and creating long-term demand for accessible, inclusive solutions.A massive, underserved consumer base
The 1.8 billion inactive adults represent the largest growth frontier in the category, far exceeding the addressable market of traditional performance-oriented products.Cross-sector collaboration is essential
While sporting goods companies are uniquely positioned to influence behavior, lasting change requires coordinated action from governments, schools, employers, healthcare providers, and urban planners.
Executive Priorities for 2025
To capture this opportunity, and contribute meaningfully to global health, leading brands are focusing on three strategic imperatives:
1. Innovate to remove barriers
Design products that address specific physical, cultural, and psychological obstacles.
Examples:
Adidas Stay in Play line (supporting women’s comfort through menstrual cycles)
Nike modest wear collections (addressing cultural requirements for sport participation)
2. Market to raise awareness and inspire participation
Shift messaging toward inclusivity, ease of entry, and everyday movement rather than elite performance.
Examples:
New Balance Run Your Way
ASICS Desk Break (encouraging movement during the workday)
3. Engage youth and communities
Invest early to shape lifelong habits through coaching, accessible kits, and school-level programs.
Examples:
Pentland’s Speedo Swim United
Shimano’s bicycle school initiatives
VI. Active Consumers Are Becoming More Intensely Engaged
Among consumers who already participate in sports or exercise, 2024 shows a clear shift toward higher engagement and more structured routines. The data in Exhibit 7 indicates that physical activity is not only holding steady in this group, it is accelerating.
Nearly one-third of active consumers (32%) increased their activity levels compared with last year, while over half (52%) maintained the same frequency. Only 17% say they exercise less than 12 months ago, suggesting strong stability in habits among this segment.
This commitment is also evident in how often they train. A majority exercise multiple times per week:

In total, 60% of active consumers work out three or more times per week, underscoring the emergence of a highly engaged cohort with consistent routines and rising expectations of brands.
What is behind this behavioral shift?
The data suggests several dynamics at play within the active segment:
Routines are becoming more structured, with a growing share aligning their schedules around exercise.
Consistency is increasing, with fewer consumers slipping into lower frequency habits.
Intensity is rising, as daily and near-daily exercisers now represent a meaningful portion of the market.
Implications for brands
Brands serving this segment face a consumer base that is:
training with higher frequency, leading to more frequent product use
looking for reliability, comfort, and durability across apparel and footwear
responsive to products designed for sustained weekly routines
more attentive to performance cues and technical features
This group is evolving into a distinct consumer persona, one that values quality and continuity, and whose behavior signals growing demand for products that can keep pace with frequent activity.
VII. Challenger Brands Reshape the Competitive Landscape
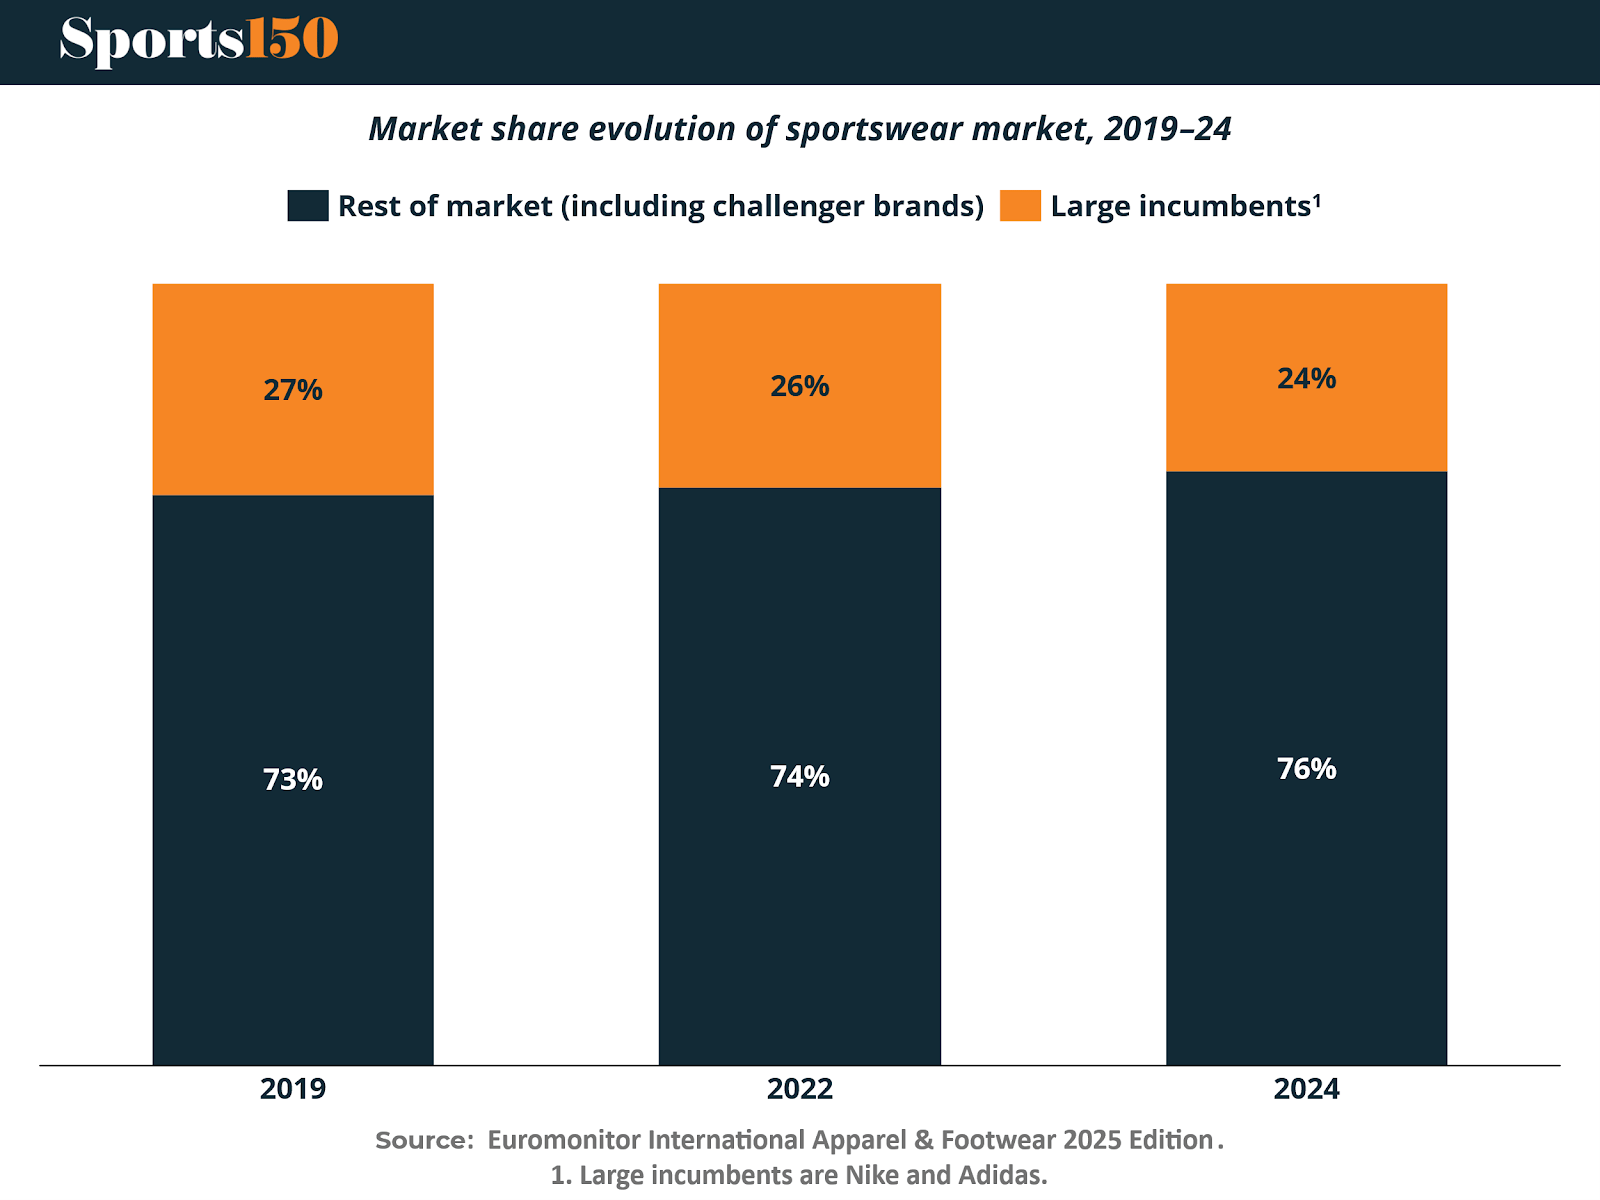
Over the past five years, the sportswear market has undergone a quiet but meaningful power shift. Large incumbents have seen their combined share decline from 27% in 2019 to an estimated 24% in 2024, marking a three-percentage-point loss. At the same time, the rest of the market, a diverse mix that includes both well-established challengers like Lululemon and On as well as newer high-growth players such as Arc’teryx and Hoka, has expanded by an equivalent three points.
This shift reflects more than a temporary fluctuation. Challenger brands are capitalizing on evolving consumer expectations around performance, lifestyle integration, and product specialization. Their ability to innovate quickly, communicate authenticity, and build communities around specific sports or aesthetics allows them to chip away at the scale advantages that once protected the industry’s dominant players.
As these brands continue to mature, their rise is reshaping the strategic priorities of the entire sector, pushing incumbents to accelerate product cycles, invest in direct-to-consumer channels, and reposition themselves in a market where brand affinity is increasingly earned rather than inherited.
VIII. Conclusion: A Category Entering Its Performance-Driven Era
The sporting goods industry closes 2025 positioned at the intersection of cultural momentum, technological innovation, and shifting global health dynamics. The market has moved past the volatility of the early 2020s and into a period where disciplined growth, consumer-centric design, and operational resilience define competitive advantage. Yet the sector is also more complex than ever: participation patterns are splitting between a highly engaged active cohort and a vast inactive population; regional growth trajectories are diverging; and the balance between innovation and profitability has become a decisive differentiator among companies.
Across all sections of this report, one theme stands out, sporting goods is no longer just a consumption category, but a performance ecosystem. Equipment continues to anchor demand, fueled by the expansion of emerging sports and the rise of hybrid training. Profitability archetypes reveal that only companies integrating innovation, supply chain agility, and disciplined execution are creating long-term value. Meanwhile, the most significant growth frontier remains untapped: the 1.8 billion individuals who are not yet active but could be, representing both a societal challenge and a once-in-a-generation commercial opportunity.
At the same time, active consumers are becoming structurally more engaged, increasing the frequency and intensity of their routines, a shift that rewards brands able to deliver durability, functionality, and seamless product experiences. Layered on top of this, challenger brands have disrupted long-standing hierarchies, accelerating competitive pressure and redefining what relevance looks like in 2025.
Taken together, the industry is evolving toward a more data-driven, inclusive, sustainability-aware model, one where value creation depends on meeting the needs of a broader and more demanding consumer base. Success in 2025 and beyond will belong to brands that can balance performance and purpose, scale and specialization, and aspiration with accessibility. The companies that thrive will be those that understand sport not just as an activity, but as a cultural infrastructure shaping global wellness, identity, and community.
Sources & References
McKinsey & Company (2025) – Sporting Goods 2025: The New Balancing Act — Turning Uncertainty into Opportunity
Mordor Intelligence (2025) – Sporting Goods Market Size, Share & 2030 Trends Report
Shopify (2025) – 9 Sporting Goods Industry Trends for 2025
Premium Perks
Since you are an Executive Subscriber, you get access to all the full length reports our research team makes every week. Interested in learning all the hard data behind the article? If so, this report is just for you.
|

Want to check the other reports? Access the Report Repository here.